STOP
GUESSING.
SEE IT.
LearnBug lets you run your own Python code step-by-step and watch exactly what happens — variables, memory, and logic visualised in real time. Not someone else's template. Yours.
Most tools give you a fixed set of problems and someone else's code to copy. LearnBug is different — you write your own code, make your own mistakes, and see exactly what happens. When your code breaks, LearnBug shows you exactly where and why — visually.
Simple, visual, powerful. Ready to finally understand your code? 🐛 ✨
From writing code to
truly understanding it
Three steps. No setup. No templates. Just your code, fully visible.
Any code — yours
Paste your own solution or write from scratch. No forced templates, no locked examples. LearnBug visualises any code you throw at it — including code with bugs.
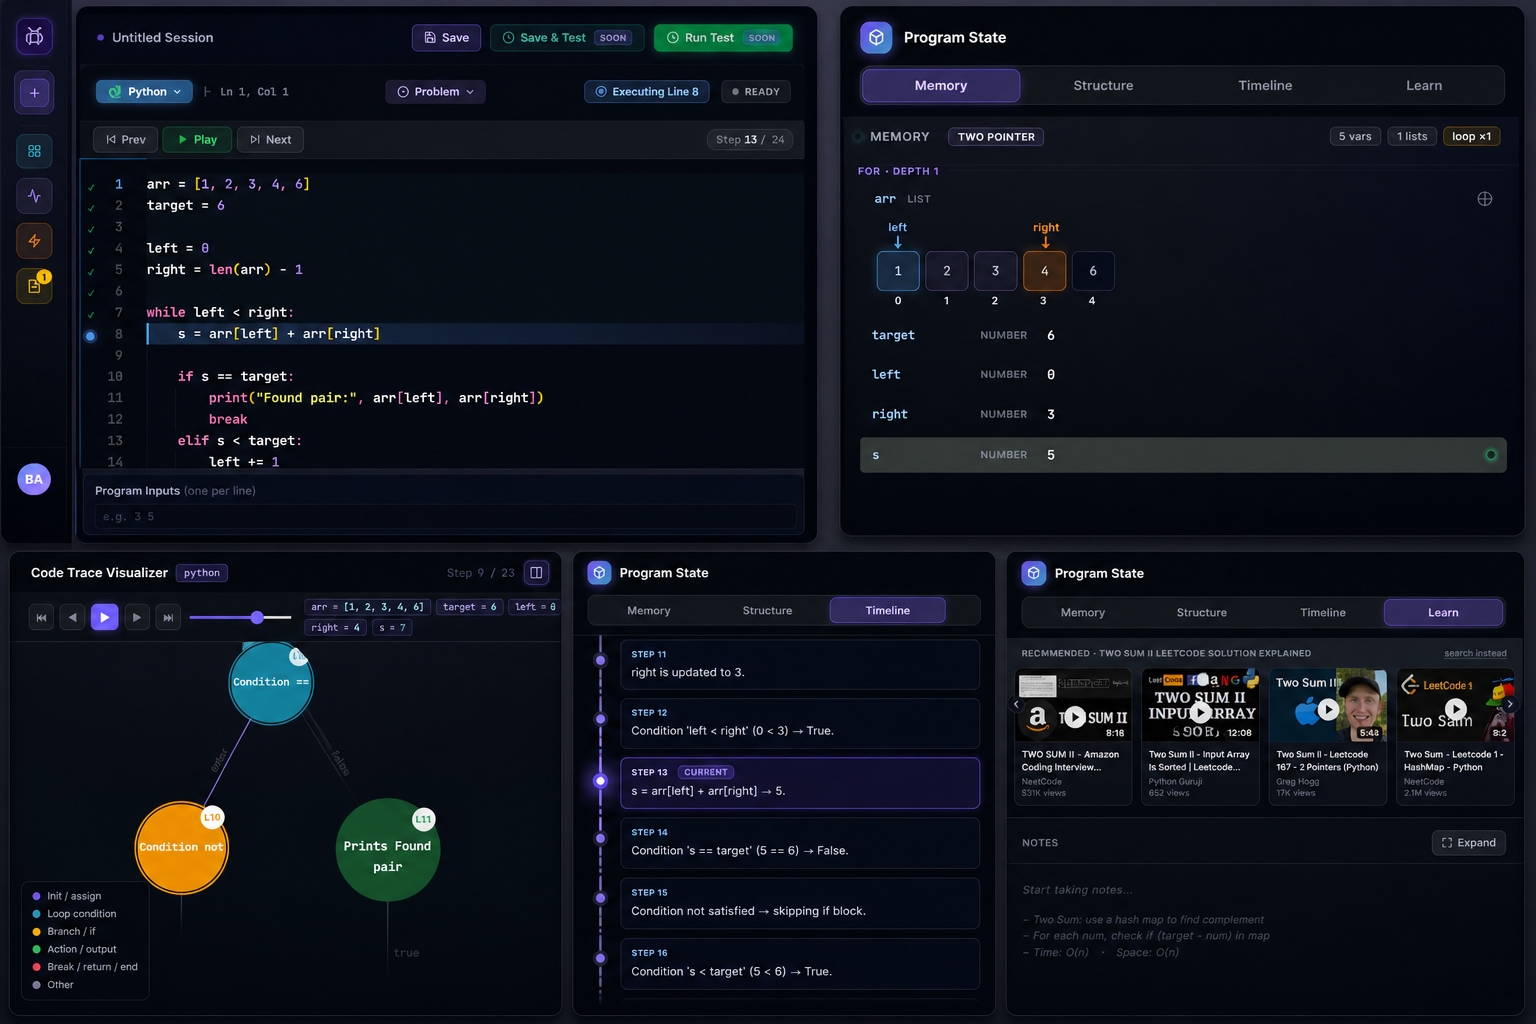
Watch every line execute
See variables update, the call stack grow and unwind, loops iterate, and memory change — all in real time, one step at a time. You control the pace.
Mistakes become lessons
When your code breaks, LearnBug shows you exactly where and why — visually. No cryptic errors. No guessing. You see the exact line, the exact state, and what went wrong.
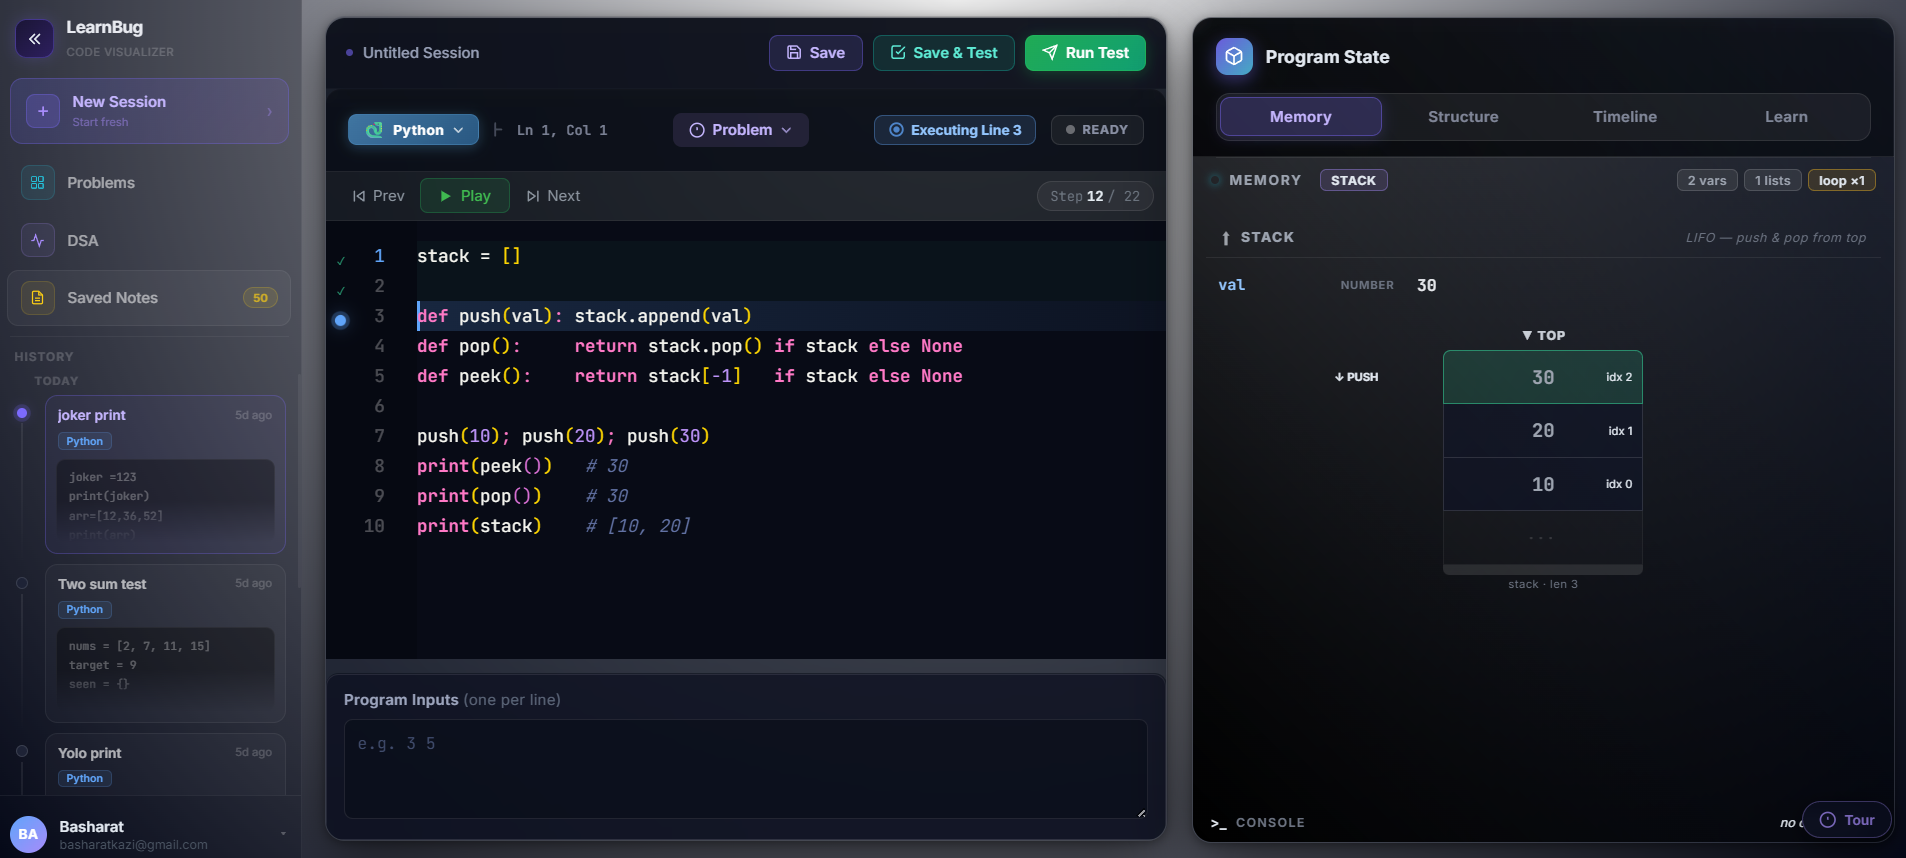
Memory & Stack View
Watch data structures build in real time as your code runs.
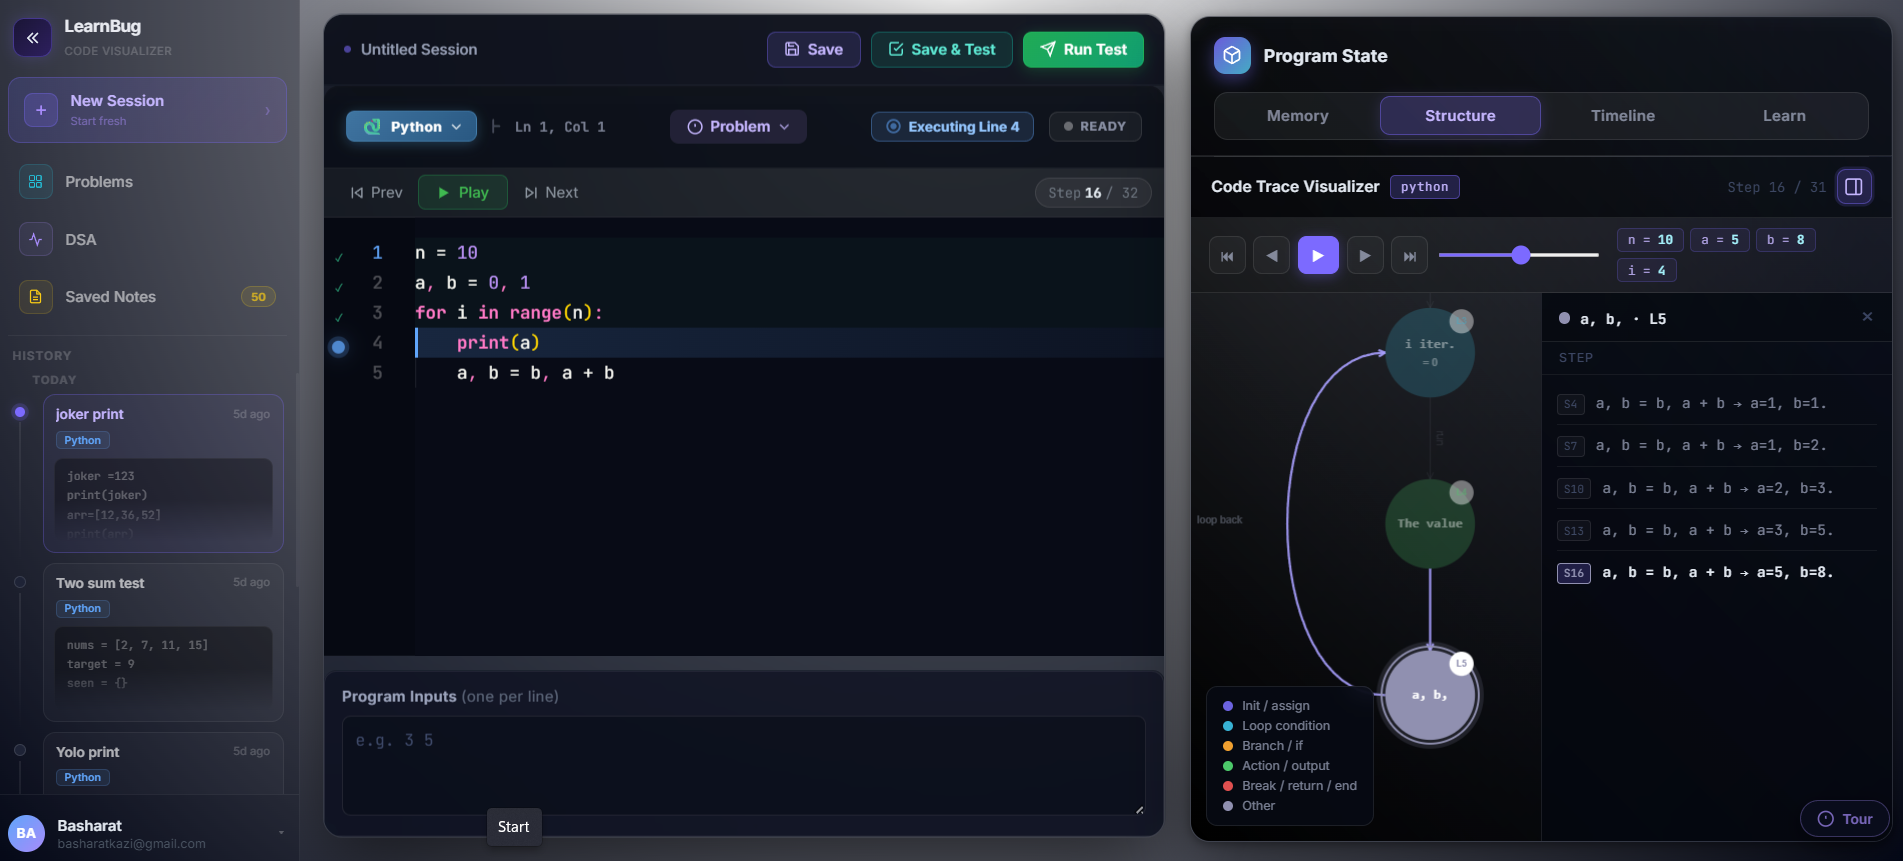
Code Trace Visualizer
See every loop iteration and branch decision mapped visually.
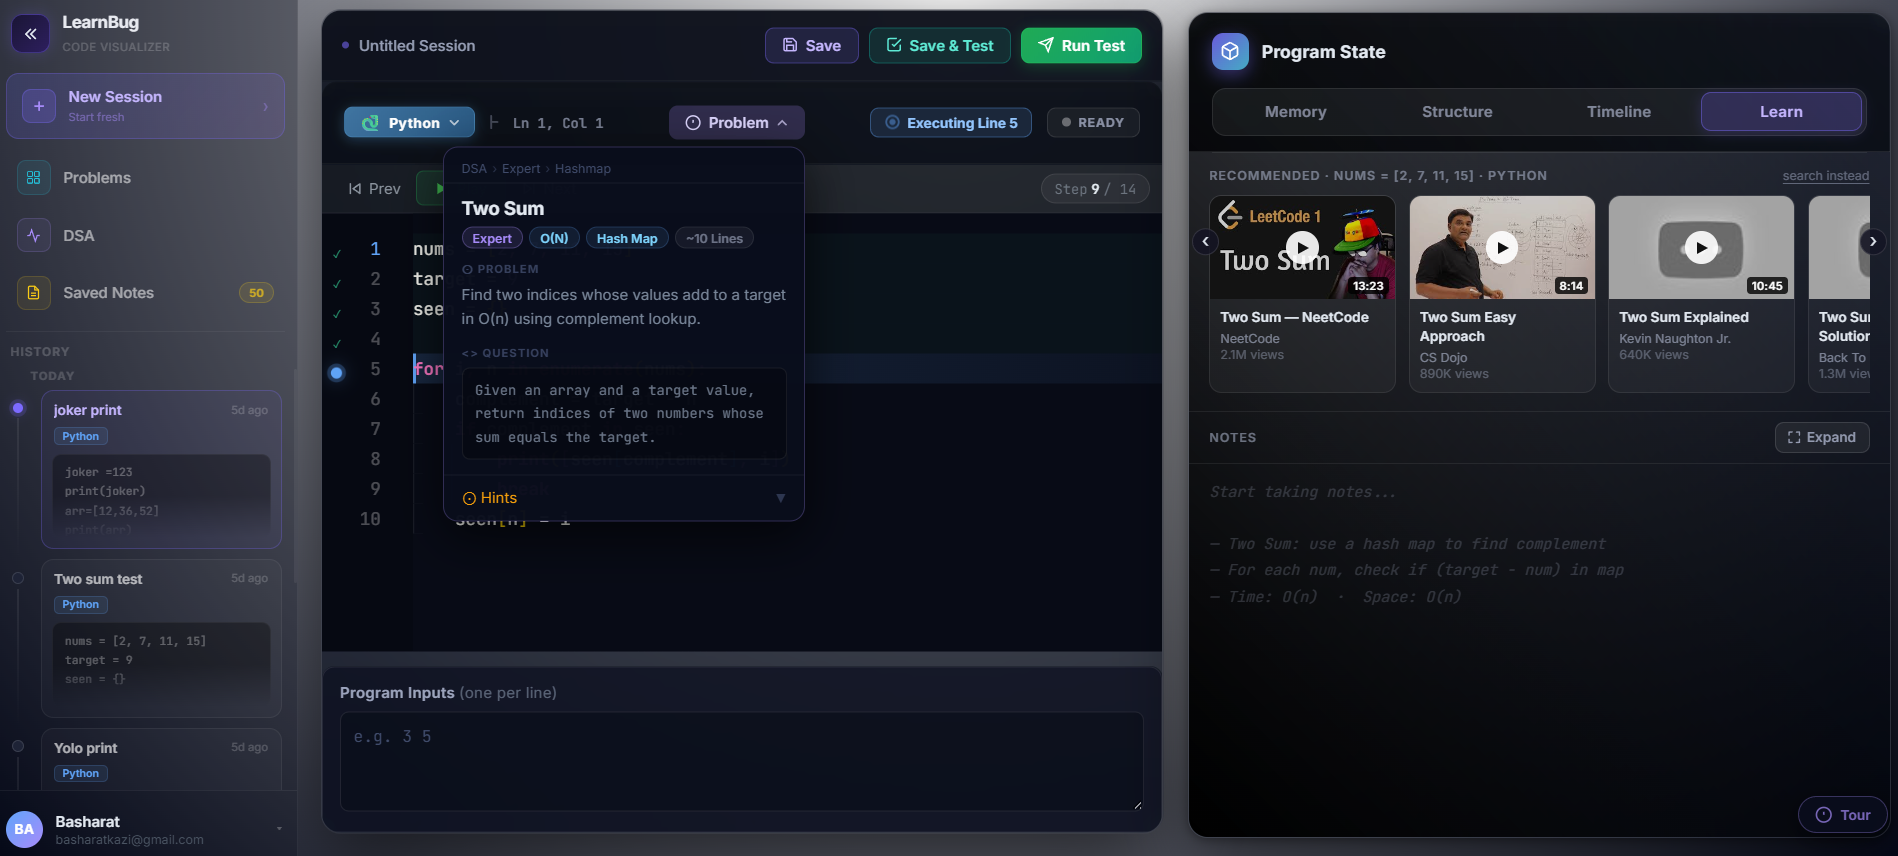
Problem + Learn Mode
Curated problems with AI insights, hints, and recommended resources.
LearnBug Features
SEE PRICING ▸The "aha" moment is real
Most users experience this in their very first session.
"I've been struggling with recursion for 3 months. One session with LearnBug and I finally get it. Watching the call stack build and unwind was the missing piece."
"I was prepping for Amazon and kept failing DSA rounds. The visual debugger made me understand binary search at a depth no tutorial ever gave me. Cracked it."
"I use this in my Python bootcamp. The visualizer replaced 20 minutes of whiteboard drawing. Students understand in two minutes what used to take an entire lesson."
The most common thing people say after their first LearnBug session.
Free for everyone.
Tailored for institutes.
We're in beta — which means every individual gets full access, completely free. Institutes and bootcamps get something extra.
Individual Users
Students, developers, and self-learners get full access to LearnBug during beta — completely free, no card, no catch.
- ✓ Step-by-step code execution
- ✓ Memory & call stack visualization
- ✓ AI error explanations
- ✓ Full DSA problem library
- ✓ Code trace visualizer
- ✓ Paste any code — no templates
- ✓ No credit card, no time limit
Beta access · 100% free · No commitment
Institutes & Bootcamps
Want to use LearnBug for your classroom, bootcamp, or organisation? We offer a dedicated dashboard, progress tracking, and instructor tools — reach out to us.
- ✓ Everything in Individual
- ✓ Institute-wide dashboard
- ✓ Student progress tracking
- ✓ Instructor management tools
- ✓ Custom problem sets for your syllabus
- ✓ Private environments for your students
- ✓ Dedicated support & onboarding
Custom pricing · Built around your needs